Macro Transmission
Follow a growth, inflation or policy shock through cash flows, discount rates and financing conditions.
Equities, rates, currencies and commodities.
Understand the transmission. Inspect the evidence.
Understand what connects market moves. Research the mechanisms, inspect the data and test the arithmetic.
Two-year and ten-year yields rose during 2022, while the gap between them changed sign. Reproduce the spread calculation from 249 matched observations.
Read the yield-curve study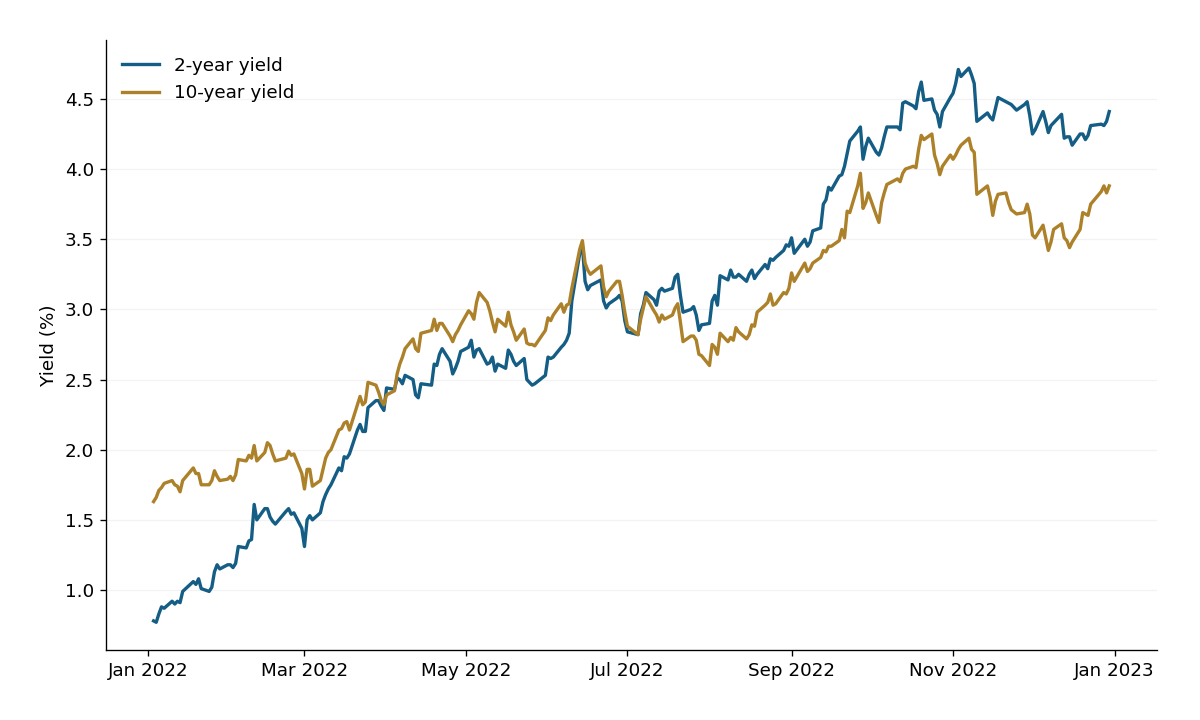
Follow a growth, inflation or policy shock through cash flows, discount rates and financing conditions.
Distinguish yield levels, curve shape, duration exposure and credit compensation.
Separate earnings changes from valuation changes and test the assumptions behind diversification.
Translate local returns, inspect funding channels and understand the exposure behind a currency hedge.
Connect physical balances, spot prices, futures curves and the instrument actually held.
Make windows, definitions, missing observations and revisions explicit enough to reproduce a result.
Trace an economic disturbance through financing, cash flows, currencies, and valuations without turning conditional mechanisms into forecasts.
Connect return co-movement to shocks, measurement choices, and portfolio arithmetic without assuming a permanent diversification relationship.
Interpret purchasing-power returns, inflation-linked bond yields, and breakevens without confusing observed spreads with pure expectations.
Identify physical benchmarks, delivery terms, futures maturities, and cash-flow conventions before comparing commodity price series.
An 8% local gain and a 5% currency decline translate to a 2.6% base-currency return. See the interaction term and adjust both assumptions.
Open currency-return toolCompare first-order rate sensitivity with a convexity adjustment across a symmetric grid of yield changes.
Open bond-sensitivity toolReproduce an 8% local gain and a 5% currency decline, including the interaction that produces a 2.6% reporting-currency return.
Read the noteCalculate a hypothetical 100-basis-point yield increase using modified duration 6 and convexity 45, excluding income.
Read the noteShow why a hypothetical 10% earnings increase and a 15% P/E decline produce a 6.5% price loss rather than a 5% loss.
Read the noteReproduce positive, negative, and zero sample correlations from explicitly hypothetical returns without inventing historical market prices.
Read the noteDarren O'Neill brings a published competition record and quantitative academic background to Vector Ridge's market research. Follow the evidence from the founder profile to the actual model publications.
Explore Vector Ridge researchDownload the study data, research protocol and source inventory.
Open the research resources